
Why high-granularity ad reporting breaks quietly
High-granularity ad data (campaign × ad set × ad × creative × day × placement) is where teams go to answer operational questions: which creatives fatigue first, where CPM spikes start, or which placements steal conversions. It’s also where dashboards often become least reliable—not because the ad platforms are “wrong,” but because the extraction layer can introduce silent bias.
The “API sampling trap” is a catch-all for two common failure modes when pulling granular ad data into BI tools:
- Aggregation bias: the query shape forces metrics to roll up in ways that change totals or ratios compared to what stakeholders expect.
- Row-limit bias: APIs cap rows per request, and downstream systems inadvertently keep only the “first N” rows, yielding partial, non-random samples.
Both problems can produce dashboards that look reasonable, trend correctly, and still be materially wrong.
How aggregation bias sneaks into “correct-looking” totals
Most ad APIs return metrics tied to a specific breakdown. If you ask for a high-cardinality breakdown (for example, by creative and placement), the platform may compute metrics at that grain differently than a higher-level view. The result: totals can shift when you change dimensions, even if you sum everything.
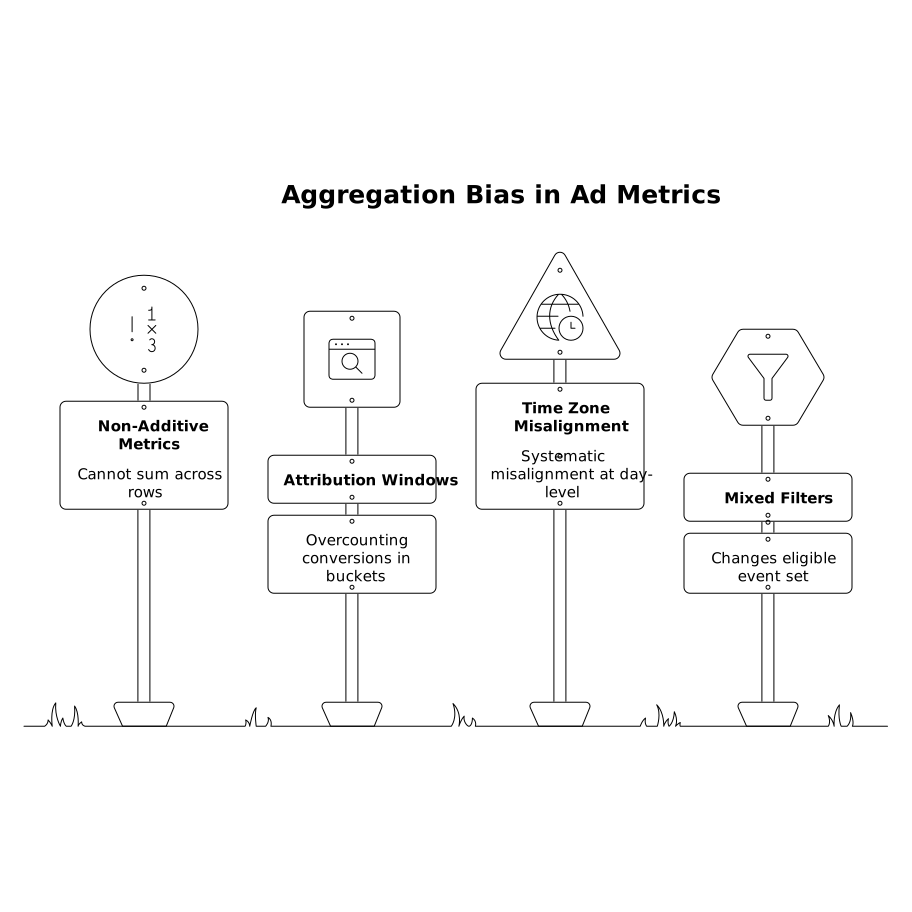
Common aggregation pitfalls
- Non-additive metrics: ROAS, CPA, CTR, frequency, and many attribution-related metrics should not be summed across rows. They need recomputation from additive components (spend, clicks, impressions, purchases) at the reporting level you intend to display.
- Attribution windows and deduplication rules: conversions may be deduplicated differently when broken down by placement, device, or creative. Summing can overcount if the platform reports the same conversion in multiple breakdown buckets.
- Time zone and “day” boundaries: pulling daily data in UTC while dashboards assume account time zone creates systematic misalignment at day-level granularity, especially around midnight and during DST shifts.
- Mixed filters: adding a dimension sometimes implicitly changes the eligible event set (for example, restricting to impressions that have placement metadata). That can change denominators and make derived rates drift.
A practical way to spot aggregation bias
Build a “reconciliation slice” that you can run consistently:
- Pick a stable period (e.g., the last 7 complete days) and one account.
- Pull a baseline dataset at a low grain (campaign × day) with additive metrics only.
- Pull a second dataset at the intended dashboard grain (e.g., creative × placement × day) with the same additive metrics.
- Roll the granular dataset back up to campaign × day and compare totals to baseline.
If spend, impressions, and clicks don’t reconcile closely, you’re dealing with either breakdown-specific logic or a partial extraction (often row limits). If additive totals reconcile but CPA/ROAS don’t, you’re likely summing or averaging ratios incorrectly in your BI layer.
Row-limit bias is worse than missing data
Most ad APIs and connectors enforce row limits and paging. That’s normal. The trap happens when the extraction process doesn’t page completely, pages inconsistently, or uses a sort order that favors certain rows. In dashboards, the symptoms can look like “creative long-tail disappears” or “smaller campaigns never show up,” even while top campaigns look accurate.
Where row-limit bias typically comes from
- Incomplete pagination: the connector stops early due to timeouts, token expiration, or a retry policy that doesn’t resume from the last cursor.
- Hidden defaults: the API sorts results (often by spend, impressions, or internal ID). If only the first N rows are retrieved, you keep a biased subset.
- BI import limits: even if the API returns all pages, the destination (spreadsheet, dashboard extract, or preview) may cap rows.
- High-cardinality explosions: adding one more breakdown (placement, device, region) can multiply rows 10–100×, crossing limits that previously weren’t visible.
Fast detection checks for row-limit bias
- Row-count monitoring per pull: track row counts by source, endpoint, and breakdown. Sudden plateaus (e.g., always exactly 10,000 rows) are a red flag.
- Topline reconciliation: compare spend totals against a trusted control query (lower grain) for the same date range.
- Long-tail sanity: track the number of unique creatives/ads/ad sets per day. If uniqueness collapses while spend stays steady, you’re likely truncating rows.
- Deterministic reruns: re-pull the same date range twice. If you get different sets of low-spend rows, ordering + truncation is likely.
Correcting the trap with query design and data modeling
Fixes usually involve a combination of “pull less at once,” “pull the right primitives,” and “compute metrics at the right layer.”
1) Separate additive primitives from derived KPIs
Design your pipeline so the extraction brings in additive metrics (spend, impressions, clicks, conversions counted at a chosen definition) and then compute KPIs in the warehouse or semantic layer. This avoids summing ratios and makes recomputation consistent across dashboard views.
2) Use staged grains instead of one mega-breakdown
Rather than pulling creative × placement × device × day in one call, stage the data:
- Pull a reliable base table at ad (or creative) × day with additive metrics.
- Pull supplemental breakdown tables (e.g., placement × day) for diagnostics and allocation.
- Join carefully only when the business question truly requires it.
This reduces row explosions and keeps core reporting stable.
3) Implement full pagination with resumable cursors
Row limits aren’t a problem if you always retrieve every page. The connector should persist cursors, retry safely, and resume without duplicating or skipping pages. If you’re building in-house, log request parameters and cursors so you can replay a failed pull deterministically.
4) Add reconciliation as a first-class dataset
Make reconciliation visible: maintain a control table of low-grain totals (account × day or campaign × day) and compare it automatically to the granular tables. When drift exceeds a threshold, alert and freeze dashboard refresh rather than publishing partial numbers.
Where Funnel fits in a reliable ad data stack
Teams often hit the sampling trap when manual exports or fragile connectors become the “data contract” for dashboards. A marketing data infrastructure layer helps because it can standardize extraction, normalize fields, and keep refresh behavior consistent across sources and destinations.
Funnel.io is designed for this kind of pipeline work: connecting ad platforms once, keeping automated refreshes running, and delivering analysis-ready datasets to dashboards or warehouses. In practice, this is most useful when you need consistent naming harmonization, currency conversion, and repeatable KPI logic without rebuilding every connector and transformation for each report.
Operational checklist before shipping a granular dashboard
- Define the “truth grain”: what level is authoritative for totals (campaign × day, ad × day)?
- Store primitives: keep additive metrics and recompute ratios in one place.
- Prove pagination: log row counts and page cursors; watch for hard caps.
- Reconcile daily: compare granular rollups to baseline totals and alert on drift.
- Document attribution rules: make windows and definitions explicit so users interpret breakdowns correctly.
If the goal is decision-making at high granularity, the reliable path is not “pull everything.” It’s designing extracts, models, and checks so that what you pull stays complete, additive where it should be, and reproducible over time.