
Why an impact map beats “read the changelog and hope”
API changelogs are written for humans, but breakages happen in systems: consumers depend on contracts, and contracts evolve unevenly across endpoints, SDKs, and event streams. A backward-compatibility impact map turns a changelog into a concrete view of (1) who is affected, (2) which contracts changed, and (3) what migration paths exist. The goal isn’t to re-document the API—it’s to produce a decision artifact within 45 minutes that engineering, platform, and product can use immediately.
The workflow below assumes you have the changelog text (release notes, PR summaries, RFC link, or OpenAPI diff) and access to basic inventory data (repos, services, SDK versions, or telemetry). If you maintain diagrams as part of your platform documentation, a text-to-visual tool like napkin.ai can help translate the final map into a clear, shareable diagram without turning this into a design task.
Inputs to gather in the first 5 minutes
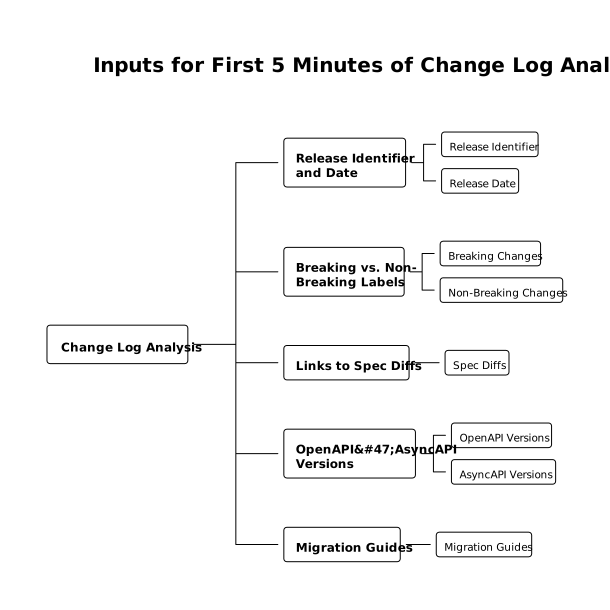
1) The change log slice
- Release identifier and date
- Explicit “breaking” vs “non-breaking” labels (if present)
- Links to spec diffs, OpenAPI/AsyncAPI versions, or migration guides
2) Consumer inventory
- Known API consumers: services, mobile apps, web apps, partners, internal scripts
- Integration style: REST, GraphQL, gRPC, webhooks/events
- Version pinning: SDK versions, generated clients, or direct HTTP calls
3) Contract artifacts
- OpenAPI/GraphQL schema/gRPC proto snapshots
- Validation rules: JSON schema, field constraints, enum lists
- Runtime signals: 4xx/5xx dashboards, request logs, schema validation errors
The 45-minute workflow
Minute 0–10: Triage changes into “contract deltas”
Start by rewriting each changelog item as a contract delta. This avoids ambiguous phrasing like “improved payload” and forces a compatibility lens. Use a simple table with four columns:
- Surface: endpoint/method, GraphQL field, RPC method, event type
- Delta: what changed (added/removed/renamed/behavior/validation)
- Compatibility signal: likely safe, conditionally breaking, breaking
- Notes: links, examples, edge cases
Typical deltas that deserve special attention:
- Removed or renamed fields (breaking for strict deserializers)
- Enum changes (adding values can break exhaustive switches; removing breaks everyone)
- Validation tightening (new required field, narrower regex, smaller max length)
- Behavioral changes (sorting, pagination defaults, idempotency, retry semantics)
- Error model changes (new status codes, different error shapes)
Minute 10–20: Identify consumer groups and usage paths
Next, convert your consumer list into groups that reflect how risk propagates. This keeps the map useful even if you don’t have perfect inventory.
- Tier 1: revenue or mission-critical flows, external partners, regulated workloads
- Tier 2: internal services with on-call ownership and CI coverage
- Tier 3: scripts, one-off jobs, legacy clients, unknown owners
For each contract delta, quickly note how consumers interact with it:
- Direct calls vs via SDK
- Static types (strongly typed clients) vs dynamic parsing
- Runtime tolerance: ignores unknown fields, handles missing fields, resilient enum handling
If you’re unsure which consumers hit which endpoints, use what you already have: API gateway logs, distributed tracing tags, or even grep-based search in repositories for path strings. This is also a good moment to align your tooling approach with how modern AI assistants select tools and sources in engineering workflows; the same principle applies here—use the most reliable signals first, not the most convenient ones. (Related reading: How AI Assistants Choose Best Tools Without Star Ratings.)
Minute 20–30: Build the impact matrix (Consumers × Deltas)
Create a compact matrix. Rows are consumer groups (or individual systems for Tier 1), columns are contract deltas. Each cell gets a risk label and an action owner.
- Green: no action (backward compatible for that consumer’s usage)
- Yellow: verify (tests, canary, contract checks, or limited code change)
- Red: migration required before rollout
To keep this fast, use heuristics:
- Field additions are usually green unless consumers use strict “additionalProperties=false” schemas.
- Field removal/rename is red for typed SDK consumers and yellow/red for direct clients depending on parsing.
- Enum additions are yellow for exhaustive matchers; enum removals are red.
- Default behavior changes are often yellow trending red for Tier 1.
Add two metadata fields per delta: blast radius (how many consumers) and detectability (will it fail loudly or silently).
Minute 30–40: Define migration paths and compatibility bridges
An impact map becomes actionable when each red/yellow cell points to a concrete path. For each breaking or risky delta, document one or more of:
- Dual-write / dual-read: temporarily support old and new fields or event versions.
- Versioned endpoints or schemas: /v1 vs /v2, or schema version fields for events.
- Deprecation window: explicit timeline and telemetry to measure remaining usage.
- SDK upgrade plan: minimum version, rollout order, and pinned dependencies.
- Adapter layer: gateway transformations, compatibility shims, or mapping functions.
Assign an owner and a deadline per migration path. If there’s no feasible bridge, mark the change as “requires coordinated release” and surface it immediately.
Minute 40–45: Turn the matrix into an impact map diagram
In the final five minutes, translate the core findings into a visual that can be shared in a release channel or incident-review style doc. A practical format is a three-lane diagram:
- Left: consumers (Tier 1 named; Tier 2/3 grouped)
- Middle: contracts (endpoints, events, schemas) with the deltas annotated
- Right: migration paths (SDK upgrade, version bump, shim, deprecation window)
This is where a “text-to-visual translator” is helpful: you can paste the structured outline (consumers, deltas, risk colors, migration steps) into napkin.ai and export a diagram that keeps the focus on decisions rather than formatting.
What to store as the durable output
To make the next release faster, store three artifacts together:
- Impact matrix with owners and dates
- Compatibility notes explaining why each risky delta is yellow/red
- Migration checklist per Tier 1 consumer
If you repeat this workflow every release, you build a living compatibility history: which kinds of changes cause real incidents, which bridges work best, and where contract tests should be strengthened.